
Quick Takes
- Volatile Stocks. US equity indices fell in February as investors began to reset expectations after earnings season, economic data, and policy changes by the Trump administration. The S&P 500 fell 1.4% while the Nasdaq 100 fell 2.8% in February.
- Inflation and Interest Rates. The 10Y treasury yield fell from 4.5% to 4.2% in February as investors sought safety. CPI and PPI inflation accelerated in January while Core PCE inflation fell slightly. Energy, food, transportation, and recreational services drove price increases. Annualized Core CPI inflation was 3.3% for the month.
- Tariffs. Trump announced that he would place 25% tariffs on imports from Canada and Mexico and put an additional 10% tariff on China. The tariffs were delayed by 30 days after Mexico and Canada agreed to cooperate with Trump on border security. Later in the month, Trump imposed 25% tariffs on all steel and aluminum imports into the US from all countries.
- China’s Economy. The launch of DeepSeek’s R1 AI model and considerable investment in AI by major Chinese technology companies has increased optimism around China’s economy. The Chinese also retaliated against US tariffs with tariffs on US coal and liquified natural gas.
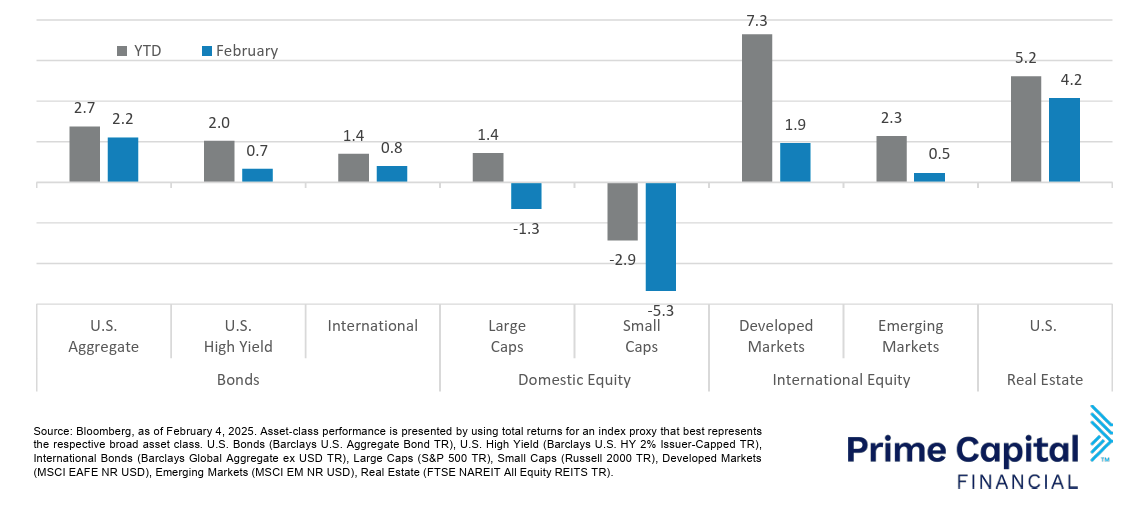
Asset Class Performance
Large caps outperformed small caps in February. US stocks underperformed international stocks, emerging and developed alike as policy uncertainty and headline risks hurt US markets harder. US bonds and real estate and international stocks and bonds rose in February while US stocks fell.
Markets & Macroeconomics
New economic data for January indicated higher price inflation and slower job growth than in December, which was a large contributor to investor angst in the stock market during the month. Headline CPI and Core CPI inflation came in ahead of expectations at 3.0% and 3.3% respectively. Headline PPI and Core PPI inflation came in even further ahead of expectations at 3.5% and 3.6% respectively. These data seem to indicate continued challenges with further reduction of inflation back to the Federal Reserve’s 2% long-term target. PCE inflation came in more in line with expectations for the month with Core PCE inflation coming in at 2.6% and the headline figure coming in at 2.5%. On the consumer spending side of things, retail sales fell sharply in January by 0.9% from December’s level, far more than expected. Retail sales excluding car sales also fell by 0.4% versus expected growth of 0.3%. Personal incomes rose 0.9% during the month of January, ahead of expectations, but personal spending fell more than expected dropping 0.2% during the month. Consumer sentiment indicators for February were below expectations as well. In the housing market, new and existing home sales both fell more than expected in January as stubbornly high mortgage rates and real estate prices hurt demand. In addition to inflationary pressures remaining elevated and consumer spending slowing in some areas, job growth slowed in January to 143K versus December’s revised addition of 307K jobs. Despite the lower rate of job growth, unemployment fell and labor force participation rose on the month as unemployment fell in January to 4.0% from 4.1% and the labor force participation rate rose slightly from 62.5% to 62.6%. Wages rose significantly ahead of expectations in January with average hourly earnings increasing 4.1% from a year earlier compared to the forecasted 3.8%. Some trouble could be ahead for labor demand, however, as initial jobless claims came in above forecasted in the last two weeks of the month. The FOMC announces its next rate decision on March 19. Investors are currently expecting a 91% probability of no rate cut in March implying that the Federal Funds target rate will remain at 4.25%-4.50%.
Bottom Line: Inflation remaining elevated and policy uncertainty around immigration and tariffs continue to be barriers to interest rate cuts by the Fed. Uncertainty amid slower job growth, deteriorating consumer sentiment, and falling retail sales in January and February will make the Fed’s job even more challenging going forward as it tries to balance inflation reduction with a healthy labor market.
©2025 Prime Capital Investment Advisors, LLC. The views and information contained herein are (1) for informational purposes only, (2) are not to be taken as a recommendation to buy or sell any investment, and (3) should not be construed or acted upon as individualized investment advice. The information contained herein was obtained from sources we believe to be reliable but is not guaranteed as to its accuracy or completeness. Investing involves risk. Investors should be prepared to bear loss, including total loss of principal. Diversification does not guarantee investment returns and does not eliminate the risk of loss. Past performance is no guarantee of comparable future results.
Source: Sources for this market commentary derived from Bloomberg. Asset‐class performance is presented by using market returns from an exchange‐traded fund (ETF) proxy that best represents its respective broad asset class. Returns shown are net of fund fees for and do not necessarily represent performance of specific mutual funds and/or exchange-traded funds recommended by the Prime Capital Investment Advisors. The performance of those funds June be substantially different than the performance of the broad asset classes and to proxy ETFs represented here. U.S. Bonds (iShares Core U.S. Aggregate Bond ETF); High‐Yield Bond (iShares iBoxx $ High Yield Corporate Bond ETF); Intl Bonds (SPDR® Bloomberg Barclays International Corporate Bond ETF); Large Growth (iShares Russell 1000 Growth ETF); Large Value (iShares Russell 1000 Value ETF); Mid Growth (iShares Russell Mid-Cap Growth ETF); Mid Value (iShares Russell Mid-Cap Value ETF); Small Growth (iShares Russell 2000 Growth ETF); Small Value (iShares Russell 2000 Value ETF); Intl Equity (iShares MSCI EAFE ETF); Emg Markets (iShares MSCI Emerging Markets ETF); and Real Estate (iShares U.S. Real Estate ETF). The return displayed as “Allocation” is a weighted average of the ETF proxies shown as represented by: 30% U.S. Bonds, 5% International Bonds, 5% High Yield Bonds, 10% Large Growth, 10% Large Value, 4% Mid Growth, 4% Mid Value, 2% Small Growth, 2% Small Value, 18% International Stock, 7% Emerging Markets, 3% Real Estate.
Advisory products and services offered by Investment Adviser Representatives through Prime Capital Investment Advisors, LLC (“PCIA”), a federally registered investment adviser. PCIA: 6201 College Blvd., Suite#150, Overland Park, KS 66211. PCIA doing business as Prime Capital Wealth Management (“PCWM”) and Qualified Plan Advisors (“QPA”). Securities offered by Registered Representatives through Private Client Services, Member FINRA/SIPC. PCIA and Private Client Services are separate entities and are not affiliated.
© 2025 Prime Capital Investment Advisors, 6201 College Blvd., Suite #150, Overland Park, KS 66211.